Revealing UK’s moving habits. We analysed and visualised all the data and compiled them into the most bizarre moving stats you’ll ever see. How does your city rank?
Here are some highlights:
- If you’re from Plymouth, chances are your new home is located the furthest away.
- People from Wakefield stay closest to home, while coincidentally also moving the biggest houses.
- Londoners are the lightest on their feet when it comes to hauling cargo.
- The most difficult move in our database came from a Swansea family, who wanted to move their 9-bedroom house all the way to Crail, Scotland (496 miles!)
But that’s not all. We analysed and visualised all the data and compiled them into the most bizarre moving stats you’ll ever see. How does your city rank? Can you consider yourself an “easy mover”, or will your dream move be a pain in the ass for your removal company?
And are Londoners really the easiest to move around?
Find out below!
Contents:
- Average moving distances and who moves the furthest?
- Who moves the biggest houses (and smallest)?
- How the pandemic has impacted Londoners in particular
- Most “pain-in-the-ass” movers in the UK
- UK’s back pain capital award goes to…
- Find out if you’re an easy mover
- Ranking all 25 cities
- Methodology
Plymovians move away the furthest
Our dataset contains over 300,000 moving requests, as filled out by UK citizens in our forms. Every request includes a “from” and “to” field, meaning that we’re able to calculate the distance of the requested move. We did so by calculating the driving distance in miles, using Google Maps’ API.
This provides us with an unique insight in how UK citizens move around the country.
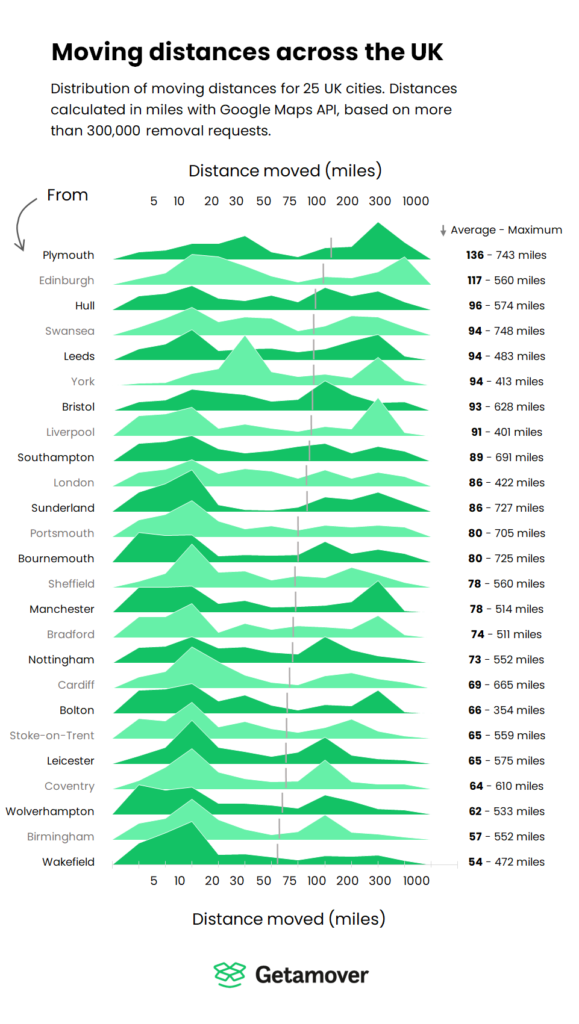
We averaged the distance of each move per city, and found that people from Plymouth are most willing to go the distance. The average Plymovian moves 136 miles, compared to the national average of 81 miles.
The top 5 is completed by Edinburgh, Hull, Swansea and Leeds. People from Wakefield are sticking close to home. Wakefielders move an average of 54 miles per move.
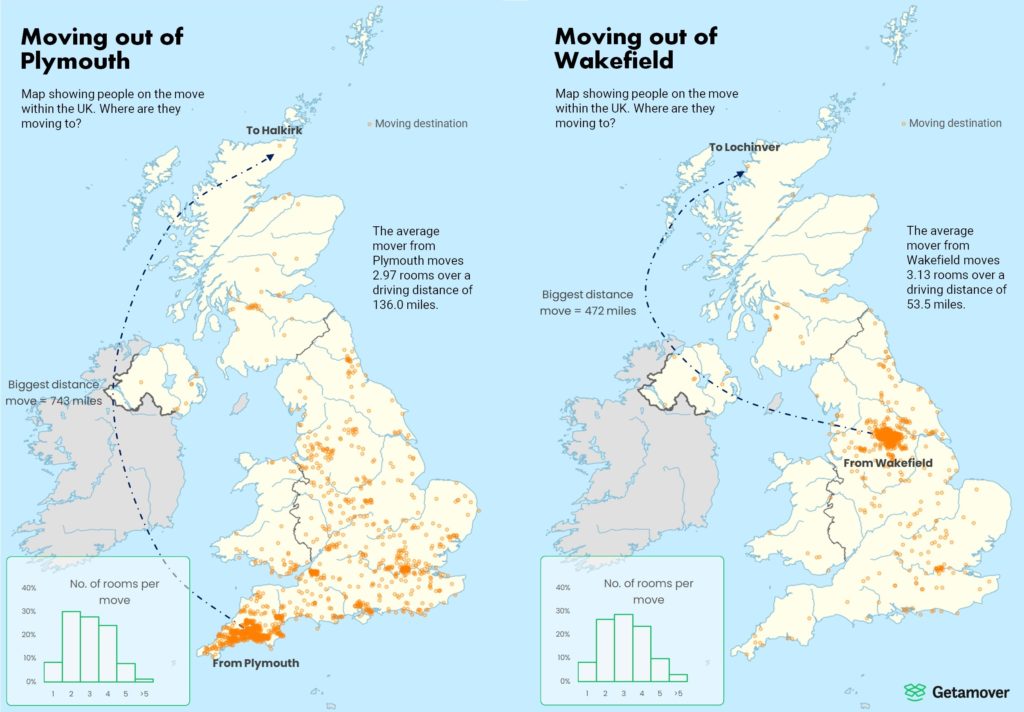
We’ve visualised this difference in a map that shows all the removal requests in our databases:This big difference is explained by the simple fact that Plymouth is situated in the far south-east corner of the UK, whereas Wakefield is pretty much in the center.
Still, the Plymovian family that moved all the way to Halkirk (Scotland) must have had a fun couple of days!
(We’ve created maps of all 25 cities, you can find them here.)
We hired a Luton van with a lift, which really saved our backs. I moved my family from Wales to Scotland and it took a lot of effort. I’m a bit of a minimalist and binned everything that was not essential, which really saved me lots of time. But even then, it took us 3 round trips with a fully loaded truck.
Client review, Aug 2020
Wakefielders are the “biggest” movers
Did you always wonder what’s the average number of rooms people move in the UK? So did we!
The average number of rooms for UK citizens on the move is 2.90.
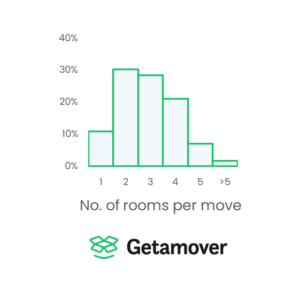
If you’re working for a moving company, you should definitely pick up the phone if someone from Wakefield calls. They tend to move the biggest number of rooms on average!
The top 5 cities are:
- Wakefield (3.12)
- Leicester (3.10)
- Stoke-on-Trent (3.08)
- Swansea (3.06)
- Bolton (3.06)
At the bottom of the list is London, with an average of 2.72 rooms per move.
This statistic is to be expected, since London is by far the most populated city in the UK. With the most expensive real estate market, it makes sense that Londoners get less room for their buck.
A note about Londoners
Londoners not only move the smallest houses, they are also impacted by the COVID-19 pandemic the most.
When analyzing our dataset, we found no real lasting impacts of the pandemic on the moving behaviour of UK citizens. However, one thing that stood out was a changing trend of Londoners in particular.
Ever since the pandemic started, Londoners have been looking to move away significantly further than before.
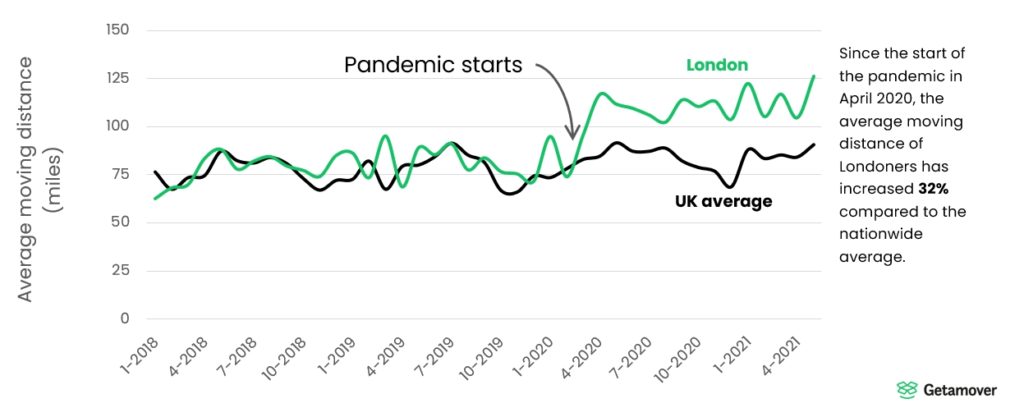
This change can be explained by a multitude of reasons. One simple reason is that it’s – by far – the biggest city in the UK, with a population of 9 million. The second biggest city is Birmingham, with only 2.8 million habitants. With the pandemic, people may have experienced the many downsides of living in a crowded city, without being able to enjoy the benefits.
As my job turned to WFH, I wanted to move out of my London flat. I found a small house in Buxton near the Peak District. All my belongings fitted inside the van and it all went superb. I love that I now live within cycling distance of a beautiful hike.
Client review, Feb 2021
An article published by CNBC explores potential reasons why people are leaving London, and argues that COVID-19 has fundamentally changed the way we view cities. With the increasing adaptation of work-from-home, it makes even more sense.
If you’re wondering where all these Londoners are moving to, our data will show you:
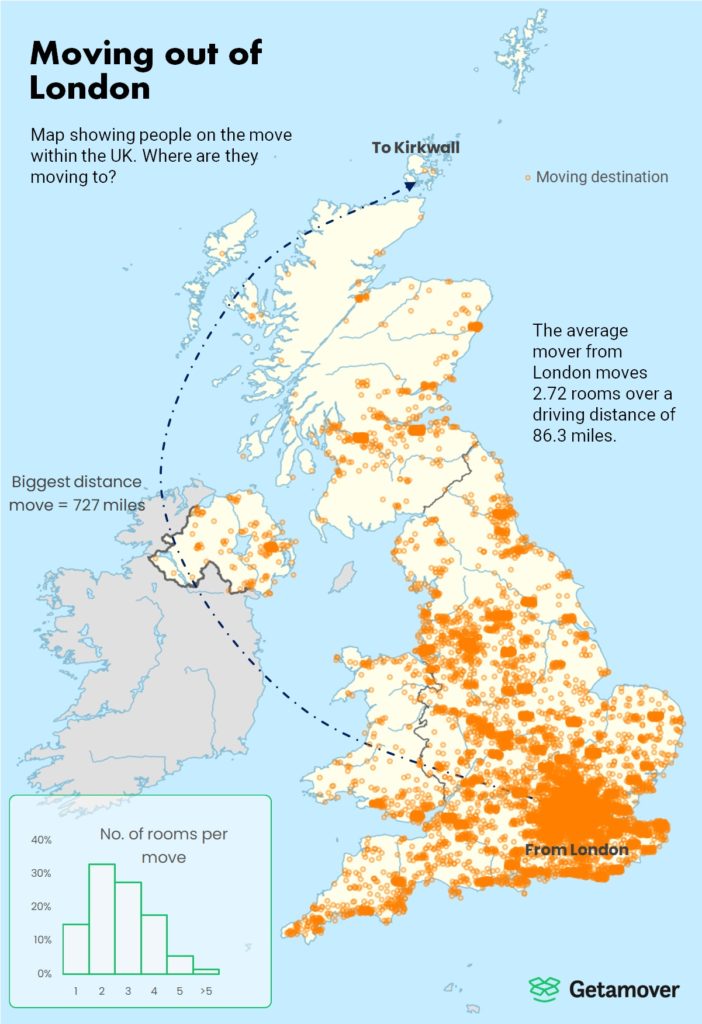
(Again, we’ve created maps of all 25 cities included in this study, you can find them here.)
The biggest pain-in-the-ass families to move
We combined the house size with the distance between point A and B and came up with another index: the biggest “pain-in-the-ass movers”.
Who tops this list?
It’s a family that moved from Swansea, Wales all the way up to Crail, Scotland. What made this move top the list in particular was the accompanying number of rooms: nine.
The top 10 most difficult moving requests we’ve received are:
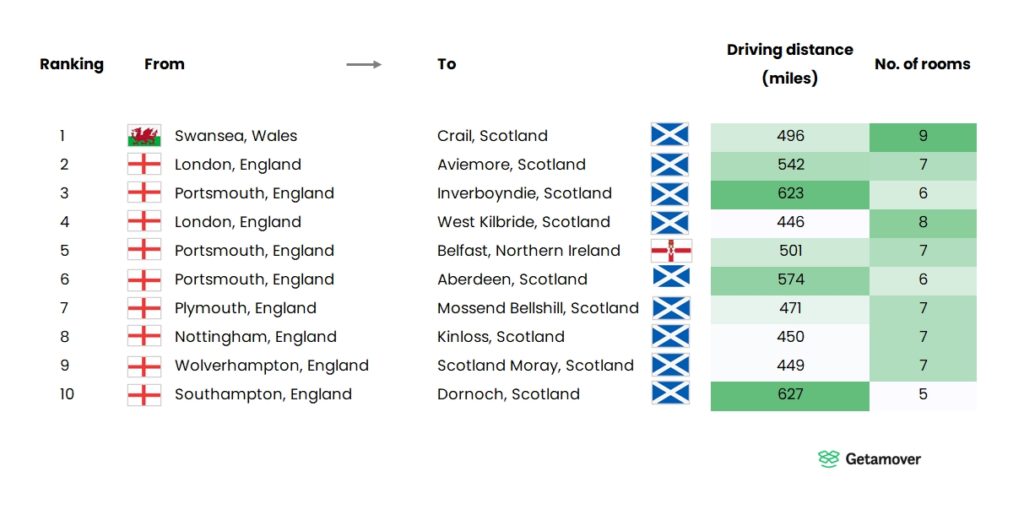
Are you considering a move of your own? You can use our own calculator at the bottom of this post to find out if you can be considered a “pain-in-the-ass” mover as well!
The national “Back Pain Capital” award goes to…
We all know the famous scene from Friends, where Ross and Rachel get stuck in a claustrophobic staircase while trying to move their couch.

In honour of that scene, we analysed our data and found the city in which movers were most likely to suffer from back pain. In other words, we found the city in which movers had to climb the most shit furniture up some stairs.
The “winner” is Swansea.
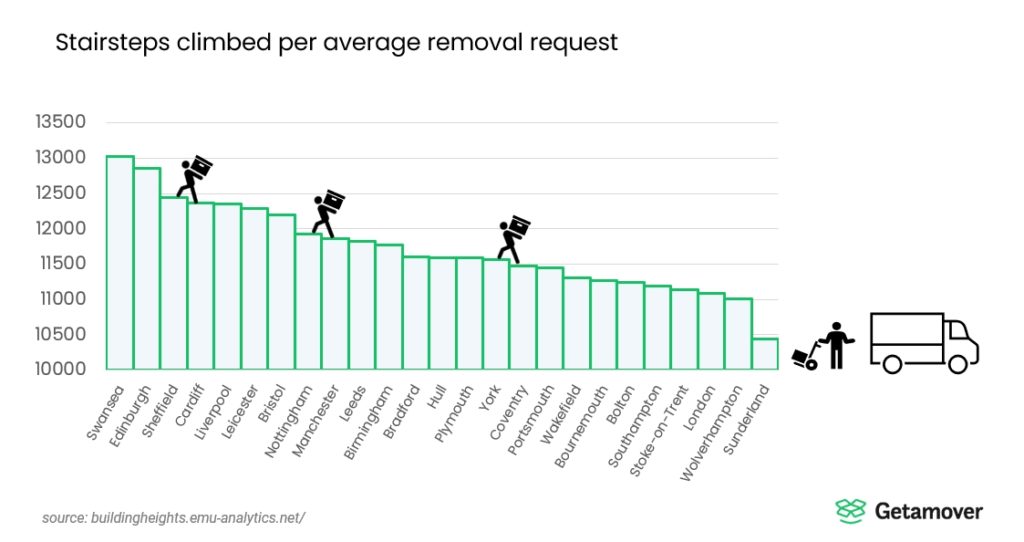
We compiled the average building heights for all 25 cities from this site. We then calculated the number of stairsteps climbed for each of the >300k removal requests in our database. We approximated the number of steps by assuming that a person has to climb up and down 5 times for each requested room.
Based on this calculation, moving companies from Swansea, Edinburgh and Sheffield do some of the heaviest lifting of the UK.
On the other hand, movers from Sunderland have it relatively easy!
Are you an “easy mover”?
Are you considering a move across the UK?
Find out if you’re an “easy mover” by using this calculator.
Will your cross-country move top the list of the biggest pain-in-the-ass move?
You can find out by entering your city, moving distance and no. of rooms below. You’ll find out where you stand right away:
Which UK citizens are the most difficult to move?
We ranked each city in our list based on the average scope of the requests, by considering the average moving distance and the number of rooms per request.
By ranking cities from most “pain-in-the-ass” to easiest average removal request, we find that Plymouth is comfortably at the top of this list.
| Ranking | City | Average distance | Average no. of rooms |
|---|---|---|---|
| 1 | Plymouth | 136 | 2.97 |
| 2 | Edinburgh | 117 | 2.88 |
| 3 | Hull | 96 | 3.01 |
| 4 | Swansea | 94 | 3.06 |
| 5 | York | 94 | 2.99 |
| 6 | Leeds | 94 | 2.93 |
| 7 | Bristol | 93 | 2.88 |
| 8 | Liverpool | 91 | 2.94 |
| 9 | Southampton | 89 | 2.92 |
| 10 | Sunderland | 86 | 2.98 |
| 11 | Sheffield | 78 | 3.05 |
| 12 | London | 86 | 2.72 |
| 13 | Portsmouth | 80 | 2.91 |
| 14 | Bournemouth | 80 | 2.92 |
| 15 | Bradford | 74 | 3.05 |
| 16 | Nottingham | 73 | 3.02 |
| 17 | Manchester | 78 | 2.81 |
| 18 | Cardiff | 69 | 3.02 |
| 19 | Stoke-on-Trent | 65 | 3.09 |
| 20 | Bolton | 66 | 3.05 |
| 21 | Leicester | 65 | 3.09 |
| 22 | Coventry | 64 | 2.98 |
| 23 | Wolverhampton | 62 | 3.00 |
| 24 | Birmingham | 57 | 2.94 |
| 25 | Wakefield | 54 | 3.12 |
Methodology
We’ve compiled these statistics from our database of >300,000 domestic removal requests from the UK. This data is anonymised and does not contain any personal information. We calculated distances and coordinates for each removal request with the Google Maps Geocoding API, based on the “From” and “To” data fields. Average building height for the included cities was compiled from this site.
All images created as part of this study can be found and downloaded here.
Fair use and redistribution
Getamover grants you permission to reuse, host, or repost the graphics and images from this article. When doing so, we ask that you kindly attribute the authors by linking to Getamover or this page.
